A recent experience from the field.
A machine operator sets up her process. A variety of inputs and variables are set to create widgets. In her industry, the measure of force experienced by a stamping press is commonly referred to as ‘tonnage’. Phoenix Systems recognizes tonnage as an output of the process- a result of inputs like material thickness and variables like press cushion pressure. A common practice in the industry is to treat tonnage as a process input to be controlled.
She documents the tonnage at 4 distinct points on each production run. Those points are labeled A, B, C, and D. Through a process called Formability Analysis conducted The Phoenix Way, she has established the following recipe and tolerance:
- Point A Recipe = 60 Tolerance +/- 6
- Point B Recipe = 56 Tolerance +/- 6
- Point C Recipe = 73 Tolerance +/- 6
- Point D Recipe = 72 Tolerance +/- 6
When setting the job up today, point A is out of tolerance. In fact, it’s below the lower limit this run and has been at the lower limit 3 of the last 5 runs. The readings have been 54, 54, 56, 56, and 53 with a tolerance of 54.
The operator contacts her supervisor and reports that the widget being created is acceptable to her customer, but Point A keeps falling at or below the lower tolerance. The supervisor has worked with this equipment for the past 23 years; his experience suggests that the equipment might be failing or it’s just not capable of maintaining these arbitrary tolerance levels. He believes these tolerances are a stretch goal, not really intended for process control. After all, tolerance is not the same as calculated control limits, right?
Phoenix System’s experience with a wide range of clients leads us to predict 3 different reactions to this scenario:
- Open up the tolerance to +/- 12 believing the equipment is too old to hold the tighter tolerance.
- Change the recipe to 53 (the most recent result), or 54.6 (average of last 5 runs).
- Ignore the signal (voice of the system) and continue running parts.
While option 3 is historically the most common, new quality systems like ISO and the evolution of process audits makes option 1 much more common.
The supervisor is right to point out that tolerance is not the same as a control limit. And the tolerance is anchored to a recipe, which is different from a mean or average of past results. But both the supervisor and operator missed an opportunity to really understand their process. They reacted to the last 5 results without context. Looking at the charts below, how different are your conclusions?
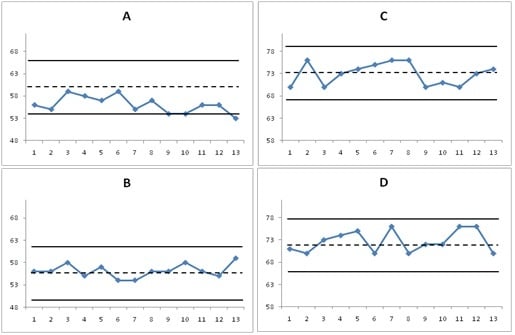
Run Chart A reflects the last 5 runs just as described before, but in context to prior results, the recipe and the tolerance. The dashed line is the recipe and the solid lines reflect the tolerance +/- 6.
When we show the operator her data in this form she quickly concludes that her old machine is quite capable of maintaining +/- 6 tolerance, in fact it is only using +0 and -7 over the past 13 production runs. It appears that an adjustment to recipe could be appropriate and potentially allow her to reduce the tolerance, not increase.
The Phoenix Way requires this change in recipe to be followed by new Formability Analysis (measurable output) to ensure the result is robust.
How you listen to the voice of the system changes what you hear. Always consider data in context to ensure you make the proper moves.