In the world of metal stamping, precision and efficiency are paramount. Engineers and manufacturers rely on innovative methods to ensure the quality and safety of stamped parts. In this article, we’ll explore how Circle Grid Analysis (CGA) and die formability predictions contribute to improved outcomes in the stamping industry.
What Is Circle Grid Analysis (CGA)?
Circle grid analysis (CGA), developed by G.M Goodwin and S.P. Keeler, is the method to measure surface strain imparted on a formed stamping. Typically, circles, squares, or dots are chemically, or laser etched onto a blank at known sizes or distances from each other. Once formed, these etched features are measured and plotted onto a Forming Limit Diagram (FLD). Once the appropriate Forming limit curve (FLC) is applied, we can determine the forming severity of the part coming out of the draw die.
What Circle Grid Analysis Can Tell Us
1. Severity & Direction of the Major & Minor Strains
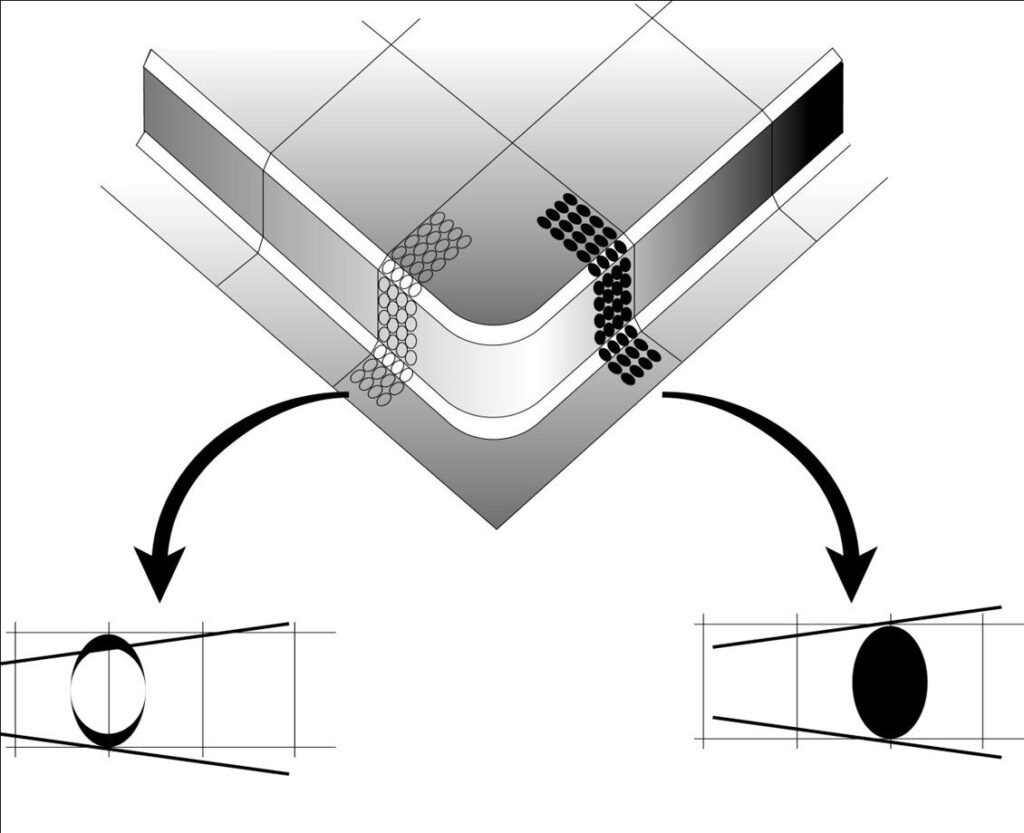
Performing a CGA requires the analyst to read the changes in the shape of the etched circle or distance between the etched dot from the original dimensions for both the major and minor strains. Understanding major and minor direction will tell us the displacement of material in the die. Knowing where the metal is being displaced from and the severity will allow you to determine which areas in the die can be strained more or less to create a safer part.
2. Nearness to Failure
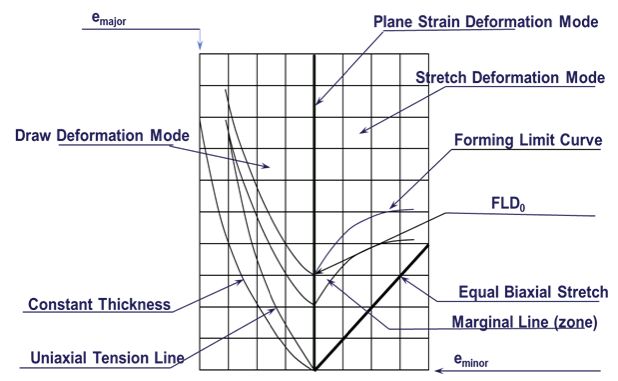
Once plotted on an FLD, we can see exactly how close a particular material is to splitting/failure. An FLD will also give you the margin of safety. A more considerable safety margin allows the tool to absorb the numerous variables involved during the stamping process and maintain a safe part. This information could also be used to consider if there are opportunities to downgauge a blank or reduce its overall dimensions. Understanding nearness to failure is crucial to maintaining part quality and production line uptime.
3. Forming Modes
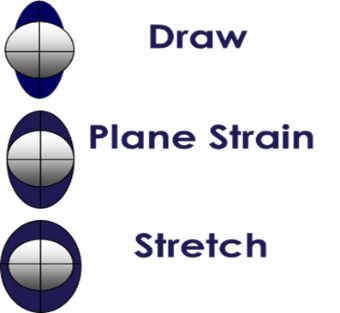
Three main deformation modes occur during the stamping process. These modes are stretch, draw, and plane strain. Each forming mode has differing failure limits, plane strain being the lowest. Knowing and understanding each forming mode ensures that die changes will have their desired effect. Typically, we feed splits but increasing the bi-axial stretch may also lead to the same outcome. Without a CGA, decisions are made on guesses, not actual forming data.
What Circle Grid Analysis Cannot Tell Us
1. Past or Future Strains
A CGA will only tell us the strain state of the grided blank at that moment. This important consideration is why the stamping inputs must represent the production inputs as closely as possible. If process control in your stamping process is uncontrolled, CGA may not be a reliable method until control is established. During the life of a die, inputs and variables change, altering the final product and possibly affecting part safety. This is also why CGA is periodically repeated throughout the life of the die.
Die Formability Predictions Compared to Hard Tool Tryout Results
The use of Computer-aided Design (CAD) and Simulation software have been around for a while now. Continuous improvement of these engineering software packages has allowed for better predictions of the formability reality of the forming processes. The software performs finite element analysis on different materials and manufacturing processes.
Software Inputs and Outputs
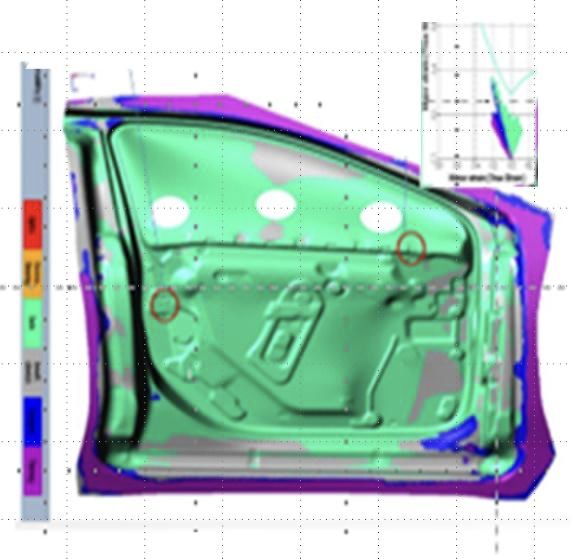
Figure 1: Door Inner Model showing Hot Spots.
This software requires critical process inputs, such as die geometry, which includes die face surfaces, radii, and other product design features. The engineer will also include the developed binder surfaces and the blank’s shape in the model. Radii in the die model will have perfect entry and exit tangencies and all surfaces will be assumed to have a consistent level of polish based on the coefficient of friction chosen. Restraining forces at the bead edge will be stated in Megapascals or converted to a bead restraint designation: examples are 50% lock bead, full lock bead, etc. These inputs, along with a list of detailed mechanical properties, are required to perform the FEA simulation. Material properties that are required include N-value, R-value, material thickness, yield strength, tensile strength, M-value (forming speed sensitivity), K-value, and a coefficient of friction.
The Simulation software will produce color graphs and FLDs of the outputs, which include the predicted percentage of material thinning, strain pairs, and metal displacement. These outputs are completely based on the modeling inputs described above. The projected blank edge draw-in amount will be added to the simulation report and should be used as a guide in the hard-tool tryout process. Some standards require the draw-in line to be milled into the binder surface for reference.
Guiding Hard Tool Tryouts
Hard-Tool Tryout should utilize the software’s outputs as a map to guide decisions on die modifications, especially during the initial tryout phase. The magnitude of strain and thinning percentages are based on the sheet metal displacement predicted in the FEA. The die maker cannot measure restraining force or the % of force compared to what is required to control metal movement through the bead(s), but the unformed blank edge should be marked or scribed on the binder surface, allowing draw in data to be collected after part formation.
Validation Process
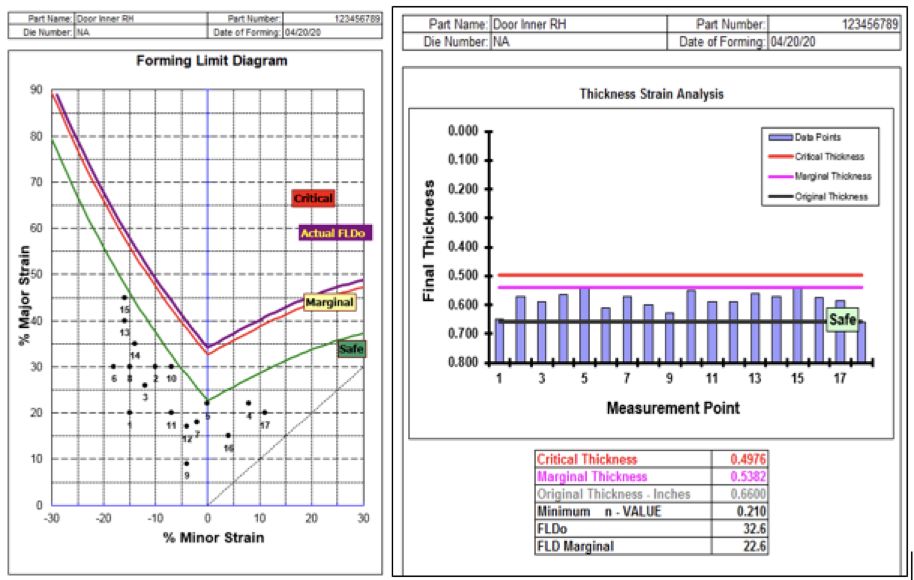
Figure 2: Door Inner CGA and TSA Results
Break-down panels with 100mm circles scribed on surfaces near the center of the part can also be utilized to evaluate global strain on the part surface. Prior to full part depth, if targeted draw-in amounts are attained, we recommend validating the accuracy of the simulation compared to actual results by comparing the projected part thickness results and actuals (using an ultrasonic thickness gauge). Radii adjacent to walls with higher thinning than the CAD data predicted need to be verified to have the correct size, micro finish, tangency (blend to the adjacent surface), and proper degrees of contact (angle of the wall off vertical). Size and tangency requirements become more significant as the radius size decreases.
As discrepancies in die design are resolved, the strain at the center of the part and draw-in amounts will closely match design intent predictions. Upon achieving full part depth, you should also verify that the draw-in amount is correct, and measure strains at the center of the part and/or in wall to ensure these align with predictions. If they don’t, determine the other issues that are impacting material flow. Check to ensure the material properties (especially n and R values) are correct. Next, examine the die-casting surfaces for porosity issues, as pinholes in the casting will magnify the frictional effect of small radii, etc.
This process can be utilized for home line tryout and for die damage recovery after a crash as well.
Contact Phoenix For a Holistic Approach to Enhancing Metal Forming Efficiency
Circle Grid Analysis and die formability predictions offer unique perspectives on metal forming, addressing the nuances of strains, failures, and predictive precision. Integrating these methodologies into manufacturing processes ensures a more controlled, efficient, and high-quality approach to metal forming.
If you’re interested in learning how The Phoenix Group can drive improvement at all levels of your organization, contact us today.