The use of Computer-aided Design (CAD) and Simulation software have been around for a while now. Continuous improvement of these engineering software packages have allowed for better predictions of the formability reality of the forming processes. The software performs finite element analysis on different materials and manufacturing processes. This software requires critical process inputs, such as die geometry which include die face surfaces, radii, and other product design features. The engineer will also include the developed binder surfaces and the blanks shape in the model. Radii in the die model will have perfect entry and exit tangencies and all surfaces will be deemed a consistent level of polish based on the coefficient of friction chosen. Restraining forces at the bead edge will be stated in Megapascals, or converted to a bead restraint designation: examples are 50% lock bead, full lock bead, etc. These inputs along with a list of detailed mechanical properties are required to perform the FEA simulation. Material properties that are required include: n-value, R value, material thickness, yield strength, tensile strength, M value (forming speed sensitivity), k value, and a coefficient of friction.
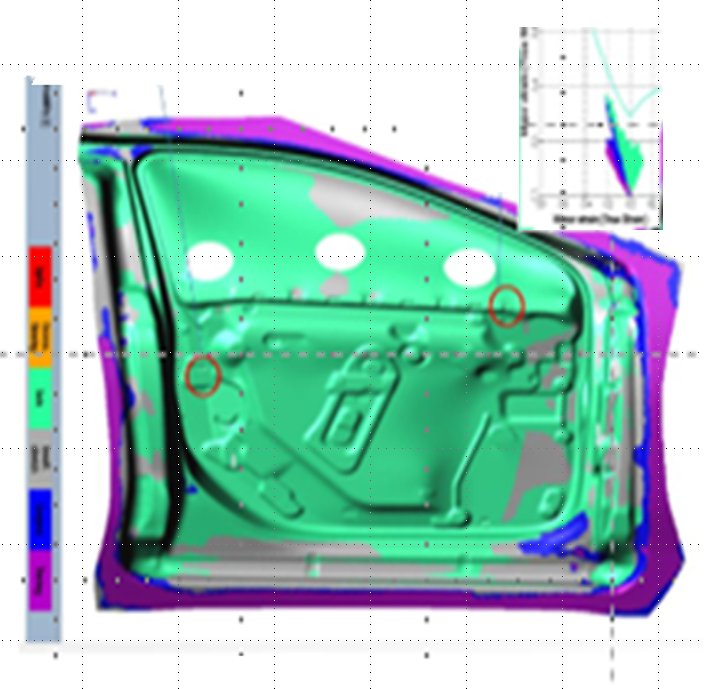
Figure 1: Door Inner Model showing Hot Spots.
Hard Tool Tryout should utilize the software’s outputs as a map to guide decisions on die modifications especially during the initial tryout phase. The magnitude of strain and thinning percentages are based on the sheet metal displacement predicted in the FEA. The diemaker cannot measure restraining force or the % of force compared to what is required to control metal movement thru the bead(s), but the unformed blank edge should be marked or scribed on the binder surface, allowing draw in data to be collected after part formation. Break down panels with 100mm circles scribed on surfaces near the center of the part can also be utilized to evaluate global strain on the part surface. Prior to full part depth, if targeted draw-in amounts are attained, we recommend validating the accuracy of the simulation compared to actual results by comparing the projected part thickness results and actuals (using an ultrasonic thickness gauge). Radii adjacent to walls with higher thinning than the CAD data predicted, need to be verified to have the correct size, micro finish, tangency (blend to the adjacent surface), and proper degrees of contact (angle of the wall off vertical). Size and tangency requirements become more significant as the radius size decrease.
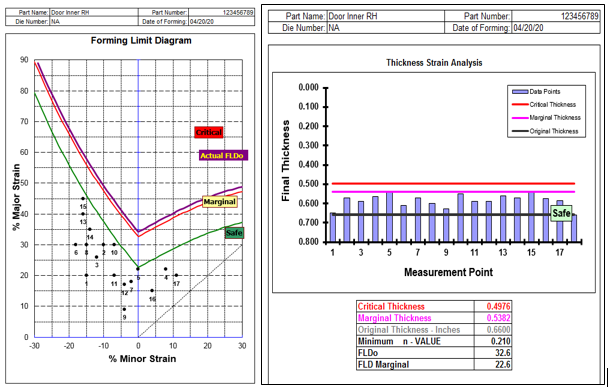
Figure 2: Door Inner CGA and TSA Results
As discrepancies to die design are resolved, the strain at the center of the part and draw-in amounts will closely match design intent predictions. Upon achieving full part depth, you should also verify that the draw-in amount is correct, and measure strains at the center of the part and/or in wall to ensure these align with predictions. If they don’t, determine the other issues that are impacting material flow. Check to make sure the material properties (especially n and R values) are correct. Next, examine the die casting surfaces for porosity issues, as pin holes in the casting, will magnify the frictional effect of small radii, etc.This process can be utilized for home line tryout and for die damage recovery after a crash as well.